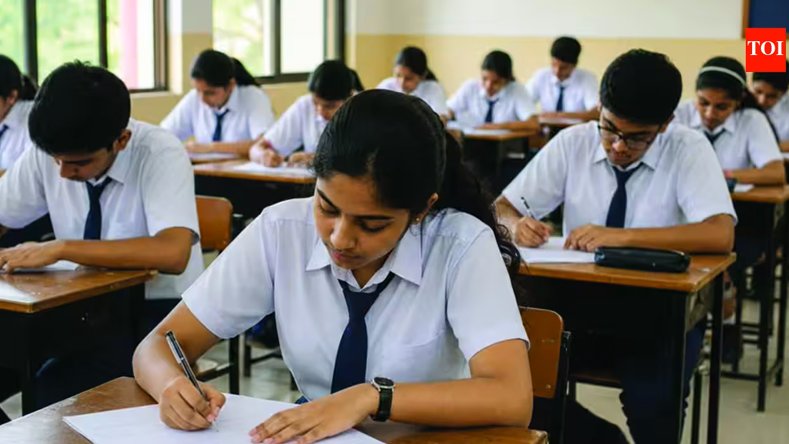
India’s education system is revealing an important divide that goes beyond access to classrooms: how much families can afford to spend on the kind of education their children receive. New analysis of data from the National Statistical Office’s Comprehensive Modular Survey: Education, conducted between April and June 2025, shows that education spending rises faster than household consumption as families move up the income ladder. The survey covers school education from pre-primary to higher secondary and includes expenditure on private coaching and tuition.
The pattern is particularly significant because it suggests that education does not behave like a basic household necessity for every family in the same way. As household resources increase, spending on education rises disproportionately, driven largely by the ability to choose more expensive schooling options.
What the Education Spending Gap Involves
Across India, households with children in school spend on a combination of school fees, transport, uniforms, textbooks and stationery, private coaching and other education-related expenses. The latest analysis estimates that households with school-going children spend an average of around ₹26,615 annually across school education, private coaching and hostel-related expenses.
But the distribution is sharply uneven.
The richest 10% of households spend around ₹67,200 a year on education, compared with approximately ₹11,700 among the poorest 10%. The resulting annual gap of ₹55,553 shows how household resources translate into very different education choices. School fees alone account for ₹35,120, or roughly 63% of this difference. Transport contributes another 13%, while coaching accounts for about 12%.
The difference is not simply that wealthier households purchase more coaching. Instead, the data points towards a larger structural shift: higher-income families are considerably more likely to move towards private schooling. The share of students attending private schools rises from roughly 18% in the poorest consumption decile to about 61% in the richest.
Private coaching, meanwhile, is spread across income groups. Around 19% of students in the poorest decile receive private coaching, compared with about 34% in the richest decile. For poorer households, coaching also represents a larger share of their total education spending.
This distinction matters because coaching can be purchased incrementally, while changing schools represents a much larger and more sustained financial commitment.
Why Education Spending Behaves Differently Across Classes
Economists use a measure called expenditure elasticity to understand how spending on a particular item changes as household consumption changes. An elasticity above one means expenditure on that item increases faster than overall household consumption.
The latest analysis places education spending at an elasticity of 1.42. In practical terms, a 10% increase in household consumption is associated with roughly a 14% increase in education spending.
However, the figure conceals major differences between individual components.
School fees have an elasticity of 3.34, making them the most income-sensitive component of the education spending basket. Transport follows at 2.83, while uniforms stand at 2.08.
Textbooks and stationery, by comparison, have an elasticity of 0.86. Private coaching stands at around 0.90, meaning spending on these items rises broadly in line with household resources rather than accelerating with income.
The distinction becomes even clearer when households are separated according to the type of school their children attend. Among households whose children are exclusively in government schools, education spending has an elasticity of around 0.74. For households that already have a child in a private school, it is around 0.89.
The overall elasticity of 1.42 therefore appears to be driven substantially by households moving between different types of schooling rather than simply purchasing more of the same educational services.
Why This Matters
The figures highlight a less visible dimension of educational inequality in India. The difference between households is not necessarily whether parents are willing to spend on their children's education. Families across income groups spend money on education, including coaching.
What changes significantly is where that money goes.
For lower-income families, private coaching can become an additional route to supplement formal schooling without requiring the family to take on the substantially larger recurring cost of private school fees. For wealthier households, higher spending increasingly translates into access to private schools and the associated services that come with them.
The latest NSO survey was specifically designed to generate evidence on household education expenditure and private coaching, providing a national picture of these spending patterns.
This also places greater importance on the quality and accessibility of government schools. Earlier national education data has identified concerns around public-school quality as one of the reasons families choose private institutions, alongside factors such as proximity, English-medium instruction and additional facilities.
The Bigger Picture
India’s education debate is often framed around enrolment, infrastructure and learning outcomes. Household expenditure adds another layer: the ability to pay increasingly determines which educational ecosystem a child can enter.
The gap is particularly visible at the school level. While coaching is relatively widespread across income groups, private-school attendance changes dramatically across consumption groups. This suggests that educational inequality may emerge not only because some families spend more on supplementary learning, but because rising household resources enable a fundamentally different schooling pathway.
The distinction is important for policymakers. If the primary divide were simply between families who purchase coaching and those who do not, expanding affordable supplementary academic support could address part of the gap. But when a large proportion of the spending difference comes from school fees, the issue extends to the relative attractiveness, quality and accessibility of different schooling systems.
The CMS Education survey itself was created to fill gaps in existing education expenditure data and provide evidence for policy formulation. It covered households across India, excluding villages in the Andaman and Nicobar Islands that were considered extremely difficult to access.
What Comes Next
The latest spending patterns raise a broader question for India’s education system: as household incomes rise, will families continue moving towards increasingly expensive private schooling, or can improvements in government schools reduce the need for that shift?
The answer will depend not only on household purchasing power but also on the quality of public education, availability of affordable supplementary learning and the cost of private schooling.
For policymakers, the spending gap provides a measurable indicator of how economic inequality can translate into different educational choices. For families, meanwhile, the numbers underline how education has increasingly become one of the largest recurring investments made during a child’s school years.
The central issue is therefore not simply how much India spends on education, but how household income determines where that spending happens—and what kind of education it ultimately buys.